Quick links:
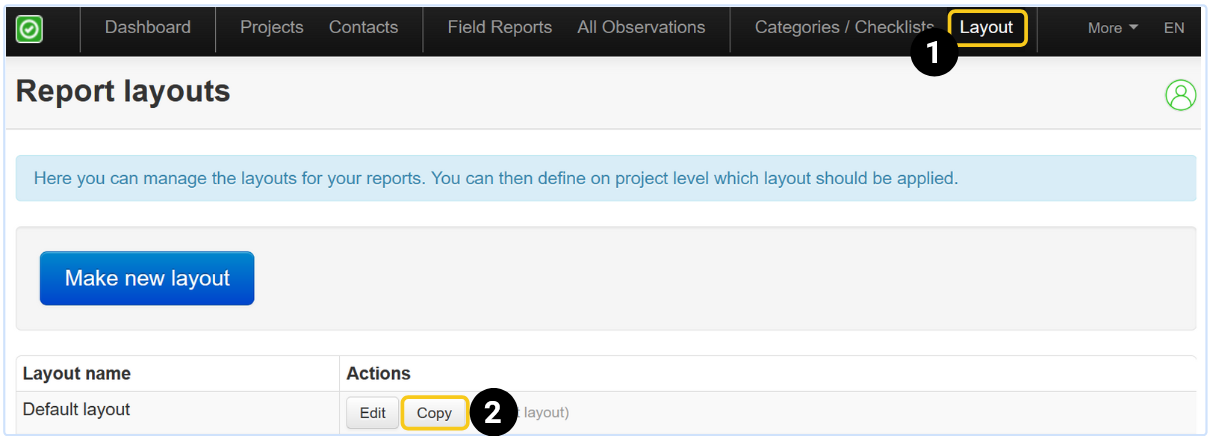
Tip: If you want a quick start, we advise you to copy the default layout in your account. In this layout, the most popular settings have been applied. All you have to do is enter your logo and company details and you're good to go, you can play with the other settings later on.
In the online account, go to Layout >> Copy (default layout).
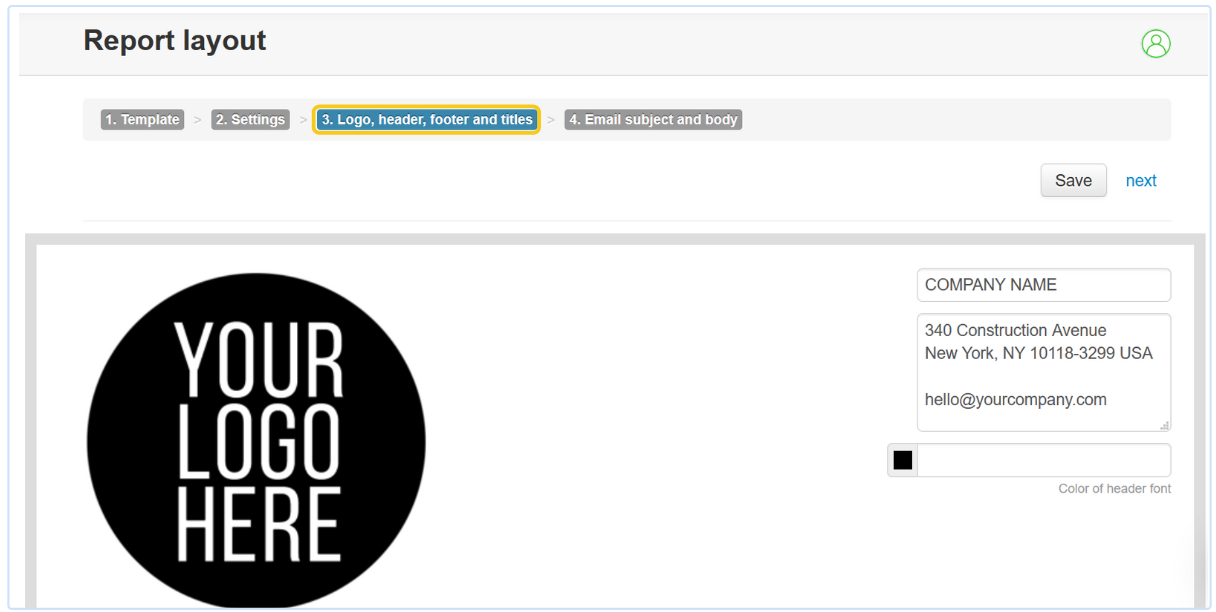
Immediately go to step 3: Logo, header, footer & titles. Add your company logo, and fill in your company details and footer. Click on the Save button.
Or, you can create a new layout template from scratch, and personalize it in 4 easy steps:
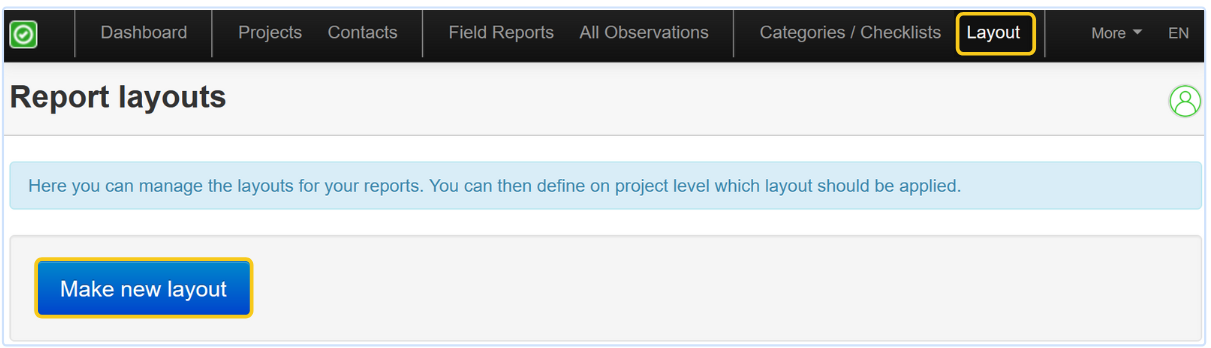
Step 1: Create a new layout
In the online ArchiSnapper account, click on Layout >> Make new layout.
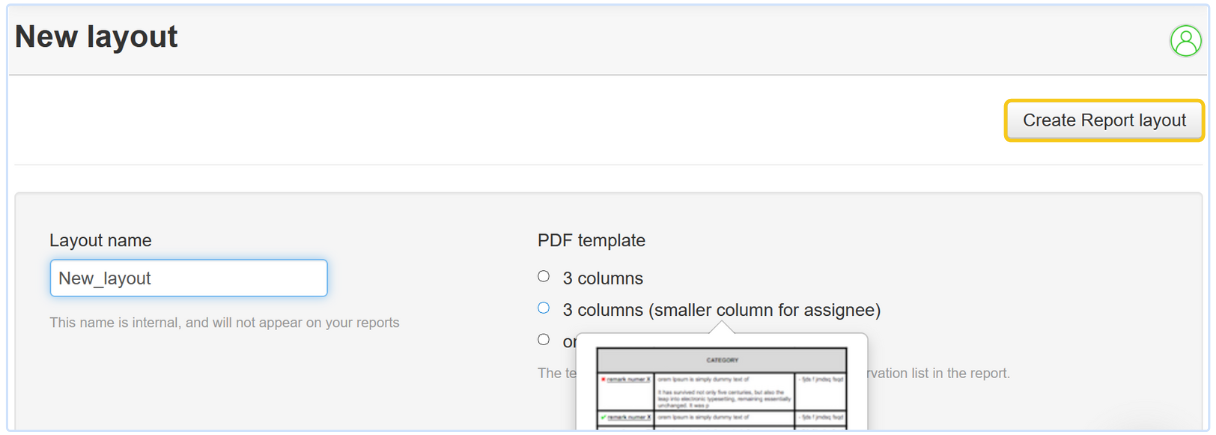
Give your layout template a name, for example, field report, daily report, punch list ...
Choose one of the 3 table templates. These determine how the observations table will be displayed in your report.
Click on Create report layout.
Step 2: Configure layout settings
Click on 2. Settings:
1. General report options
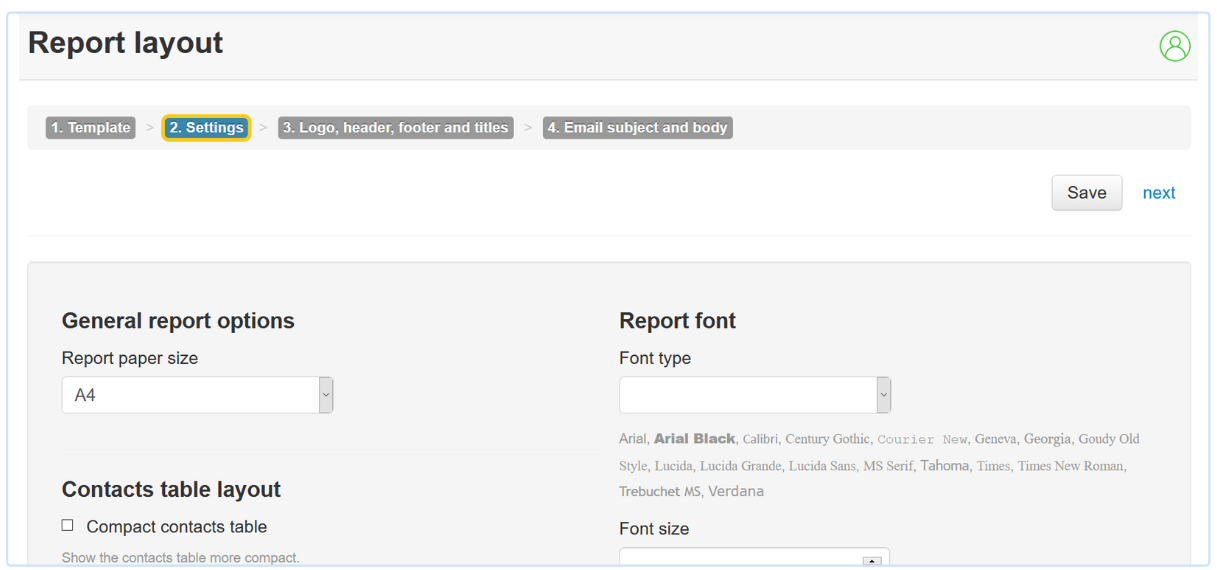
The paper size: “A4” or “letter”.
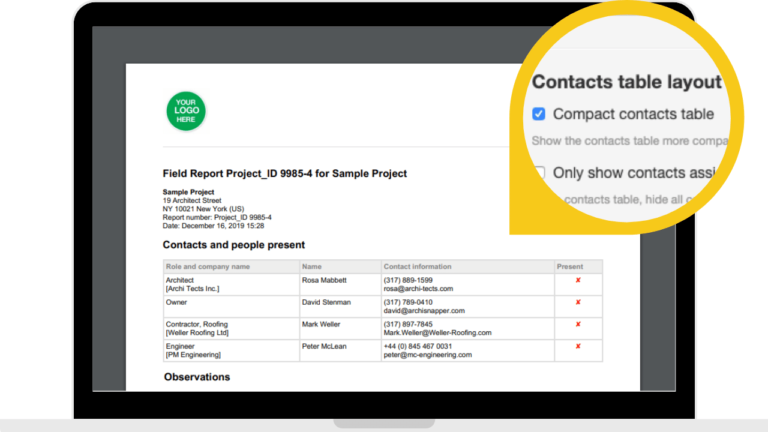
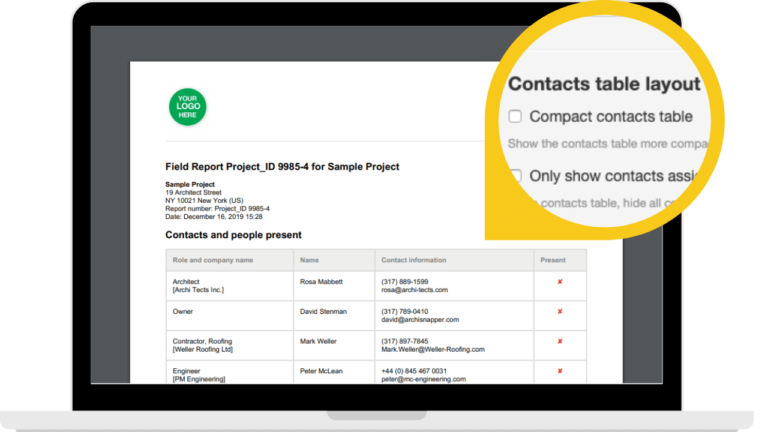
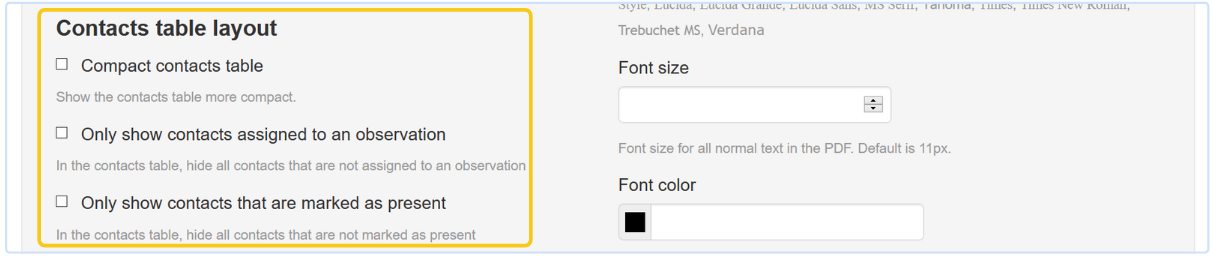
2. Contacts table layout
Choose the compact contacts table if you want to minimalize the white space for this table in your report.
Standard contacts table:
Compact contacts table (less white space):
Choose which contacts should be displayed in the contacts table of the report:
All project contacts
Only the contacts assigned to an observation
Only the contacts marked as present
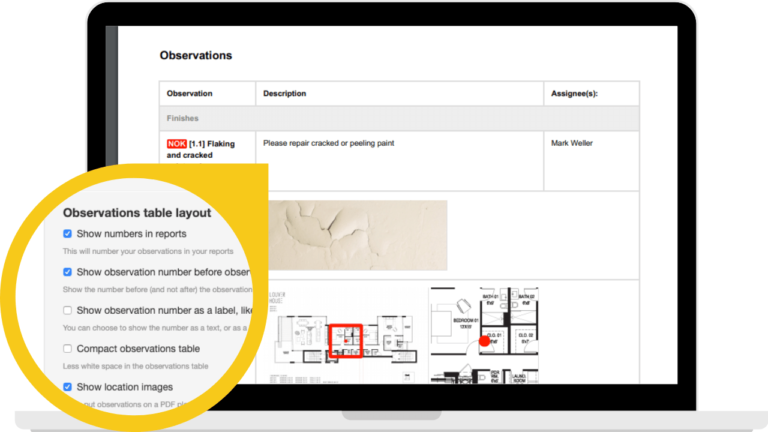
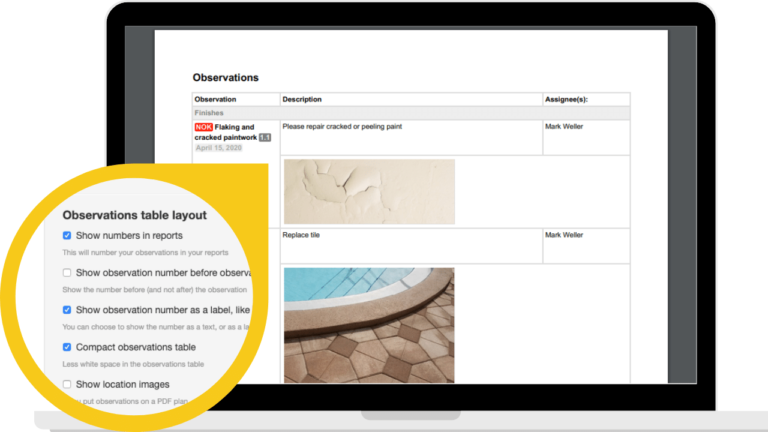
3. Observations table layout
Choose how observations will be displayed in your reports:
Show observation numbers in reports
Show these numbers before or after an observation
Show the observation numbers as a label
Compact observations table (with little white space)
If you locate observations on a PDF plan, show an image of this location on the plan in the report
Here are some examples where you can see the layout settings at work in an actual report:
4. Report photos
Choose how the photos will be shown in your reports:
Picture size: small, medium, or large.
Keep photos and text on the same page.
Show photo summary below report. This will show all photos in full size at the bottom of the field report.
You can also choose to reformat your pictures to squares. This results in nicer PDF reports. You can choose to squeeze or crop. See the effects here. Btw, even better: you can also take square photos with most tablets and smartphones, see settings when taking a photo with your device.
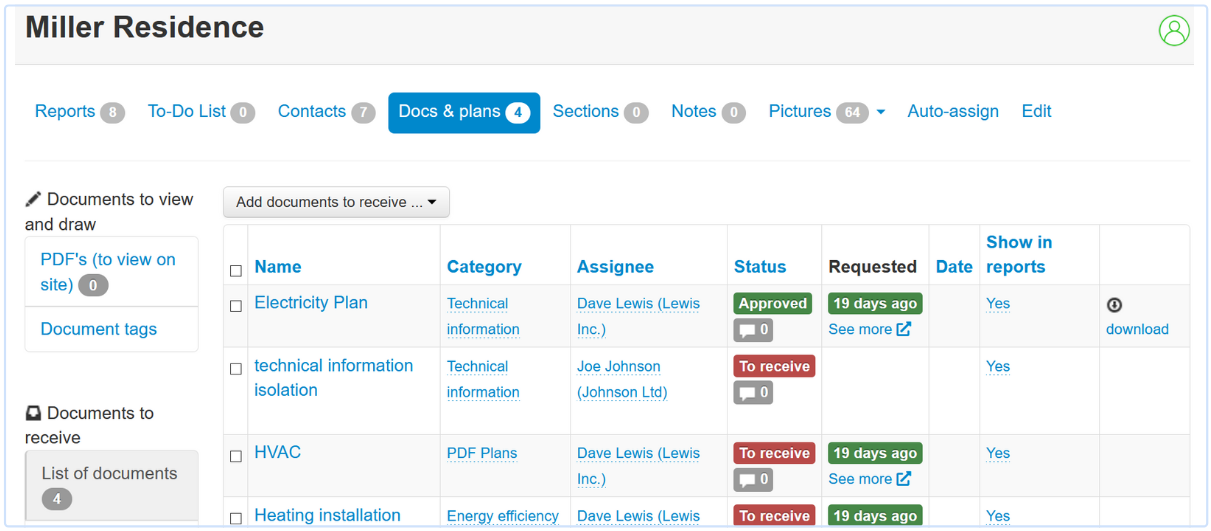
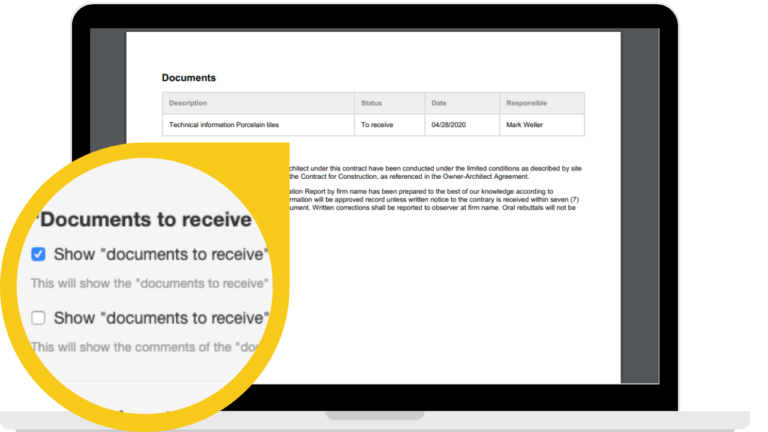
5. "Documents to receive" options
For each project, you can create a list of documents to receive (more info here):
See the "Show documents to receive" setting if you want to display this list of documents to receive in your reports:
6. Observation status labels
Check "Show status as a label" if you want to show the observation status (OK, NOT OK, NA) as a label or as text:
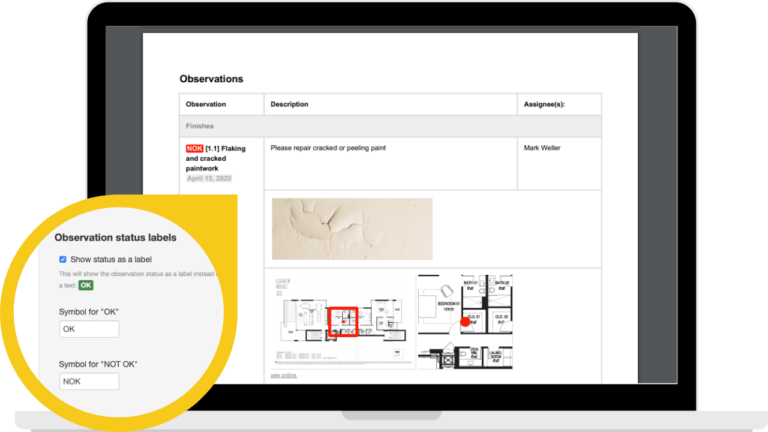
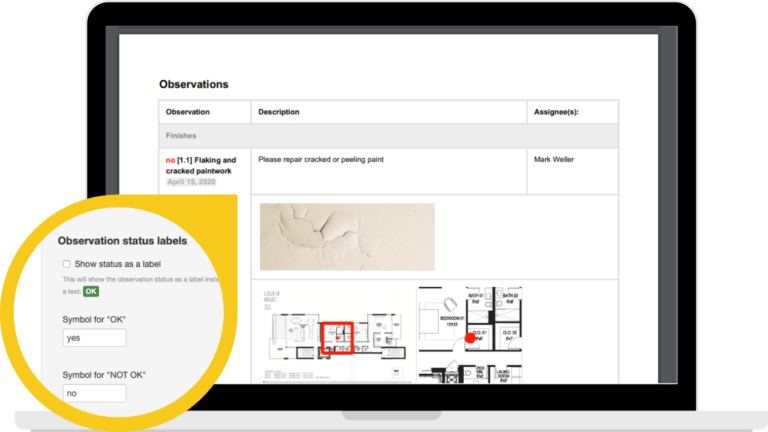
Add a symbol, or text for the 3 statuses, and choose the label color.
TIP: the standard symbols in your account are:
✔ for OK
✘ for Not OK
• for blank
You can add different status symbols as well using their HTML codes. Here's a list of symbols, we don't support all of them, but you can test and try. Use the symbols from the "dec" column, and place a &# before the code.
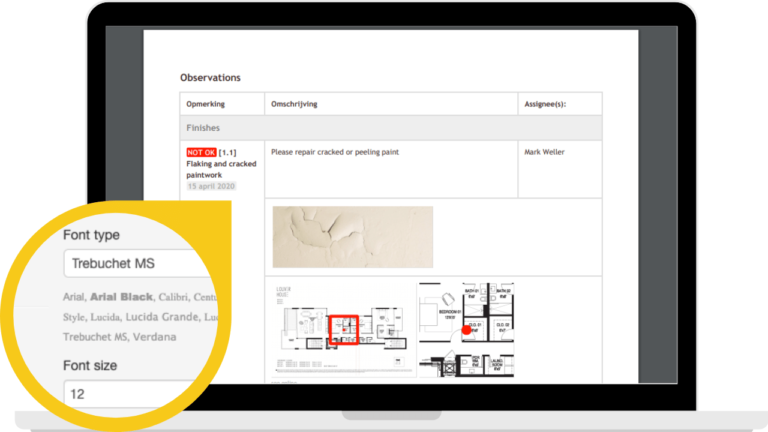
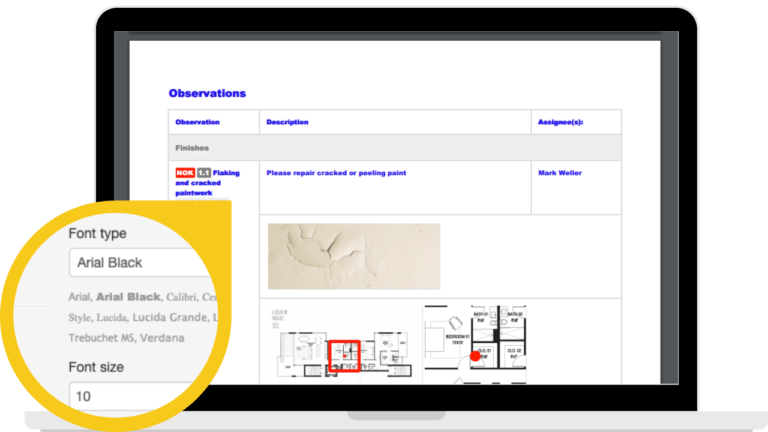
7. Font type
Choose the font type, size, and color for the text, the titles, general conditions, and categories of your reports:
8. Cloned observations
Indicate here whether you want to highlight observations copied from the previous site report, using the clone function. You can highlight them in yellow, or underline them.
9. New observations
Indicate whether you want to highlight new observations in a report. You can highlight them in yellow, or underline them.
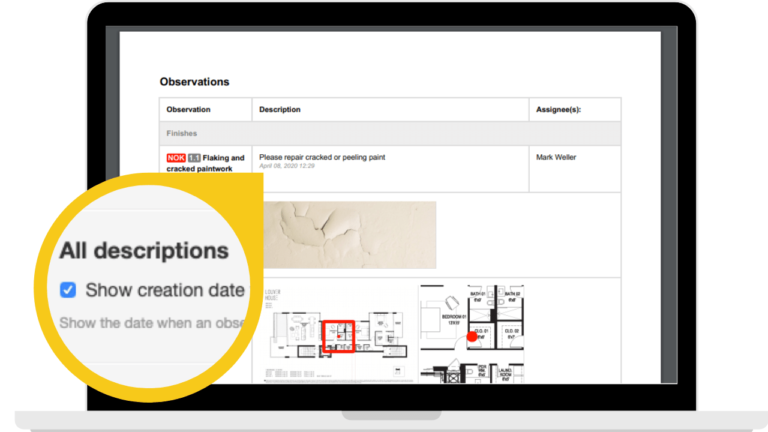
10. Observation description dates
Select "Show creation date for observation descriptions" if you want to show the date when an observation description was added to an observation. This is an interesting setting if you want to track the history of the different descriptions added to an observation during different site inspections. See below for a screenshot of a report where you can see the description date for an observation:
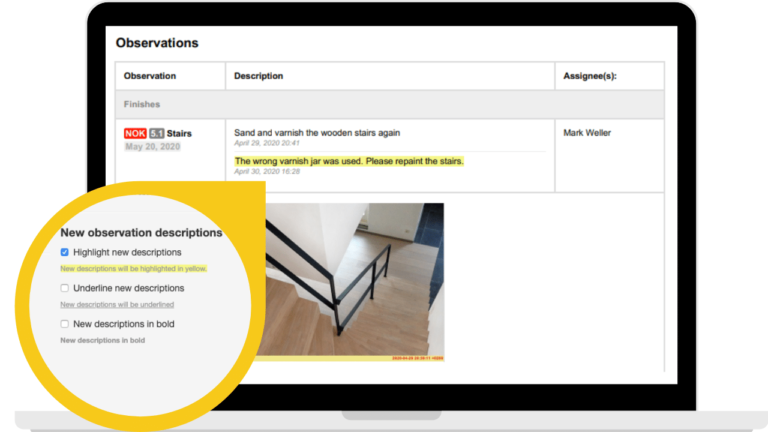
11. New descriptions (for an observation)
Choose whether you want to highlight new descriptions for observations that are cloned from a previous report. This can be done in 3 ways: highlight in yellow (see example below), underline, or bold.
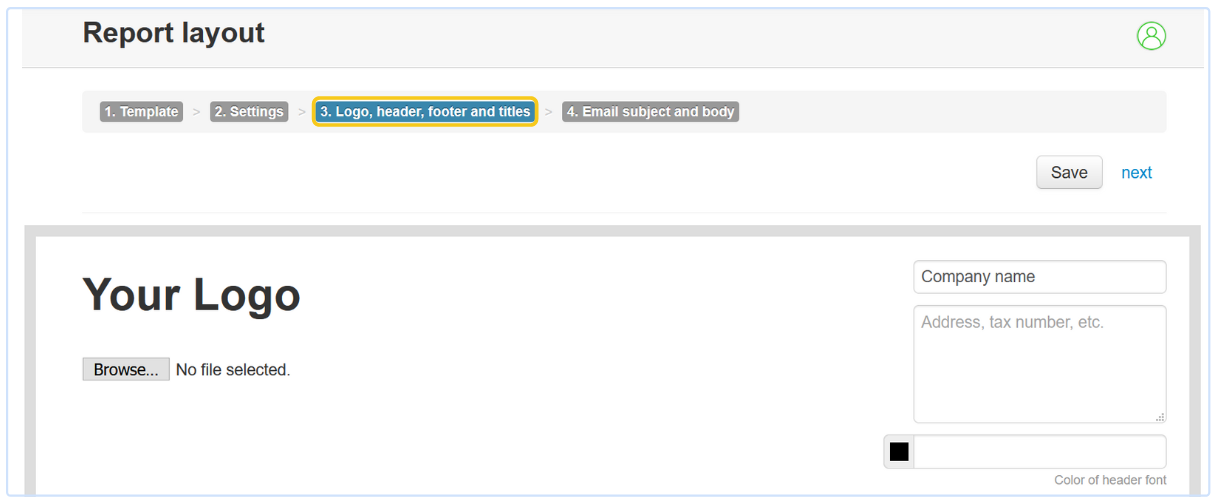
Step 3: Add your own branding
Click on 3. Logo, header, footer, and titles, add your company logo, in .jpg or .png format, at the top left. At the right, enter your company details, and then fill in the 9 blocks:
1. Report title
Enter the title of your report, we strongly recommend using variables for this.
For example: Field report no [report_number].
Variables are always placed between [square brackets].
By using variables (for Project number, project description, report date, or other fields) these fields are filled in automatically for every report. This way you don't have to manually enter them every time.
For example, if you choose the title 'Field report [report_number]', this means that each report's title will be 'Field report', followed by the report number. The report number consists of the unique code of this project and a sequential number for the reports.
For example: for the third report of project 123, the report number will be 123-3.
For the sequence number of the report (eg report 3 in the example here above) you can use the variable [report_unique_index].
2. Status
The next block of text to be displayed in your report is the 'Status'. Choose the title for this status block, it could be "Status", "State of the Works", or "Weather conditions", for example.
3. Free text block
Next, you'll see the first of three "free text" blocks. Here's more information about working with these free text blocks.
4. Status pictures
This block will show the project status pictures. Choose a title for this block, like for example "Status Photos".
5. Contacts table
Scrolling down, you'll see the table for contacts and people present. This is the table with all the contacts of the project, together with a column indicating who was present during the site visit, and who received the report.
Choose a title for your contacts table, for example, "Contacts and people present", and for the column headings.
6. Observations
In this table, you'll find all your observations (with descriptions, photos, locations, sketches and annotations, and assignees).
Choose a title for this table, like "Observations", or "Items to be resolved" and choose the headings of the columns.
7. Documents
This is the table with an overview of documents to receive for this project. If you do not use this functionality, this section will not be displayed in your reports.
Choose a title for your list of documents, for example, "Documents to be received", and fill in the column headings.
8. General conditions
You can add a title and text here, and the content will automatically be displayed at the bottom of all your reports.
9. Signature
Upload a signature if you want it to be displayed at the bottom of all your reports.
10. Footer
Choose which info you want to display in the footer of your reports, for example, company details, page number, or name of the creator of the field report.
Use variables to automate the footer details, for example: Report made by [report_creator_name] [page] / [topage].
You'll find the footer text at the bottom of every page of your report.
Step 4: Setup an email template
Click on 4. Email subject and body and set the sender's name, and the subject and body for the email. Also here you can use [variables] so the report number, project name and other fields are filled in automatically when distributing your field reports.
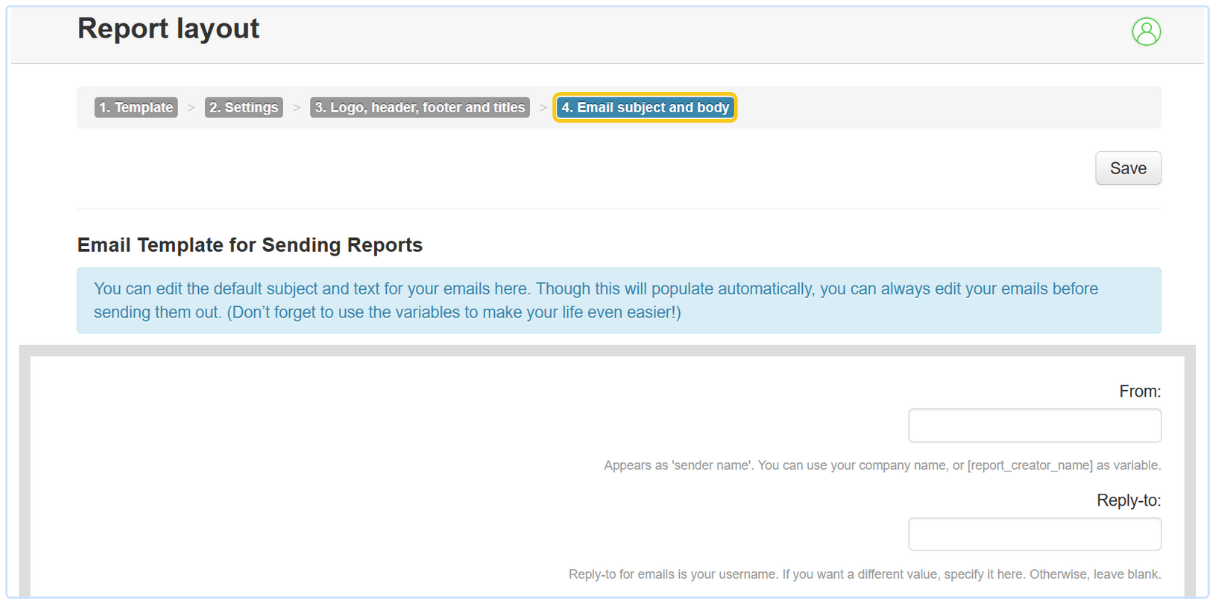
From: Appears as 'sender name'.
TIP: Use your company name, or the variable [report_creator_name].Email subject: choose a subject for your email.
Example: Field report [report_unique_index] for project [site_name].Email body: write a standard text for this email (you can still edit this when sending the actual report).
Example: Dear, please find attached report [report_unique_index] for the [site_name]. Best regards, [report_creator_name]Email signature: Upload an image; this image will be added to the bottom of your email as a logo or signature.
Don't forget to Save when you're done.
Questions? Support@archisnapper.com.